
Price and Volume Variance
Understanding the basic pillars of sales variance, i.e., price and volume variance.

A few years ago, when I was in retail, we had a brand that was breaking all ground. It was growing year on year, with double digits. Nobody was unhappy, everybody made bonus. The brand had good products, it was not rocket science that shoppers kept coming back, buying more products and spending more.
It was a random conversation I was having with one of the brand managers, and he said something that stuck with me. “We keep opening new stores, so of course the overall sales keep increasing. But in terms of organic growth, we’re in the red.”

It was a very basic concept, one that I would land up using a lot in my career, but at the time, I was a little anxious. If they were to change the bonus structure, a lot of employees will be a) trying to understand what just happened and b) not get any bonus.
The truth was this brand was growing in sales on the back of more stores opening (volume) but not in terms of value (revenue per store had actually decreased). It was another version of volume+price variance.
1. Why is this analysis important?
The volume vs. price variance analysis is a fundamental concept in understanding revenue growth and analyzing margins and sales.
Price-Volume (PV) analysis is a very old concept, this is an interesting article written in 1970 (so it’s safe to assume this analysis is at least 53 years old).
Pricing is an important lever to increase the profit %, and this reason alone makes the analysis critical.
This also throws light on effectiveness of budgets and controlling actions as the PV analysis can be used to see deviations at a SKU level.
It’s important for product managers and business heads to understand breakdown of revenue growth - is it all discounting, what is the effective price increase, which products have shown both volume and price growth, which products showed a volume decline when price increased etc.
I’ve struggled with it in the past, and finally broke it down with math (and geometry). Hope this helps anyone looking to understand the concept.
2. The math
Imagine sales in year 1 and sales in year 2. If the sales have increased, is it because of volume or price?
Sales in year 1 = Volume in year 1 * Price in year 1
Sales in year 2 = Volume in year 2 * Price in year 2
Sales Variance = Difference in sales between the two years, or
S2 – S1 = (V2.P2) – (V1.P1)
Imagine the graph below, to calculate the sales variance, we are essentially subtracting the smaller area (S1) from the larger area (S2) and the difference, i.e., dark grey = the sales variance. Sales variance can be explained by either volume variance or price variance.
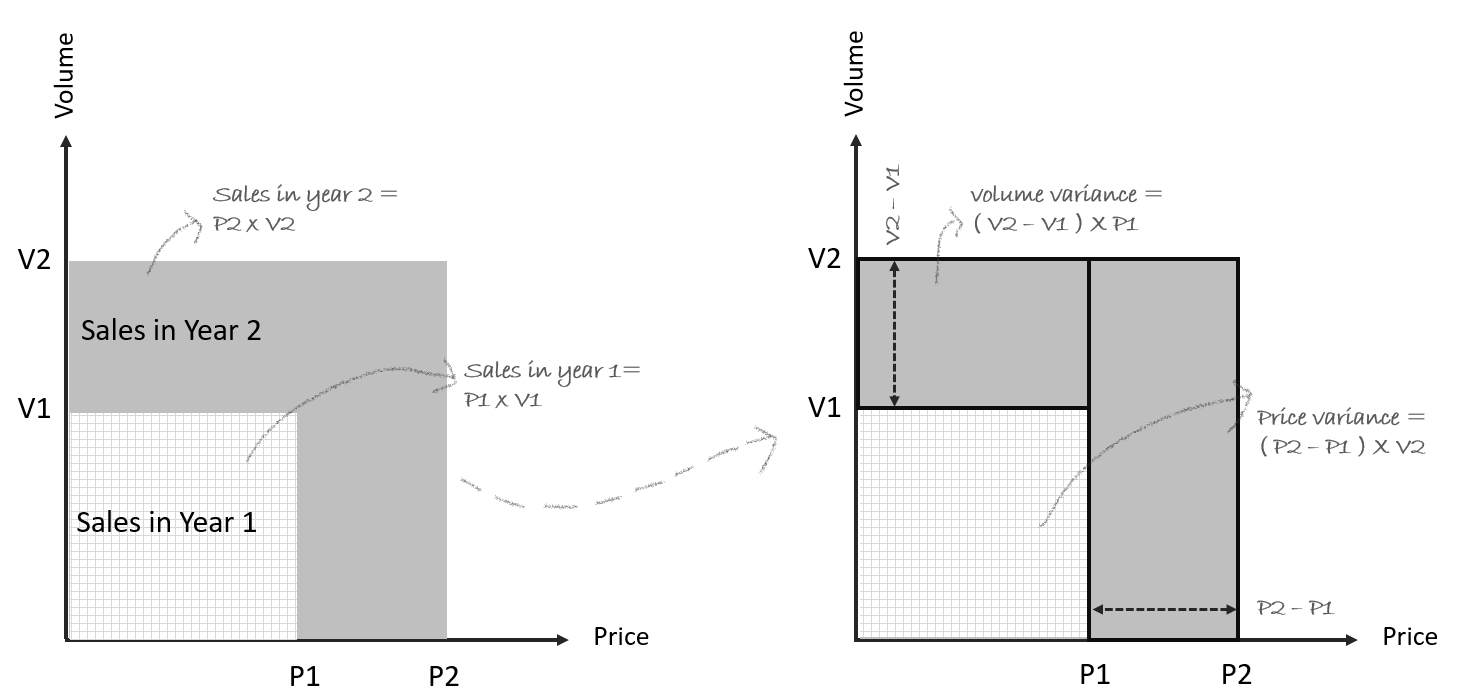
Going back to our shaded dark grey area, we now have 2 imaginary boxes.
o Volume variance = (V2-V1) * P1 : Difference in volume * old price
o Price variance = (P2-P1) * V2 : Difference in price * new volume
This is the most basic variance calculation breaking down if the business grew on the back of volume increase or price increase.
3. An example
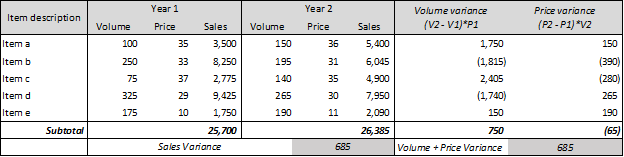
In the above example, I’ve illustrated a business with 5 items and upon doing the sales variance analysis, we realize that sales grew merely because of volume variance, price variance was in fact negative – this is very useful to know as an analyst and it can aid in building a price strategy / incentive scheme / setting targets for specific product lines.
This analysis only makes sense if the product has been sold in both years.
It’s good practice to create sub-categories where it is clear whether the product is new business, lost business or repeat business. Only the repeat business can be further analyzed and split into price and volume variance. (like we did above).
4. A waterfall illustration
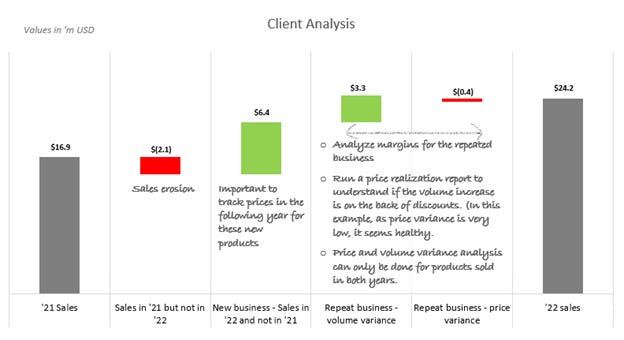
For the above client analysis, it is clear that revenue has grown because of 2 key factors, new products sold and volume variance of repeat products. The price variance seems to be in red indicating small discounts given to some products – it would be very interesting to see if discounts were given with the intention of volume increase. I have linked this file where you can see the calculation for the above graph. Since new business is significant for the above client, it’s important to track the margins for that category, and then, next year, to see if the prices have stayed the same (or increased/decreased).
When this analysis is combined with margins, it becomes more interesting as you can understand which items are bringing down overall margins and important decisions can be taken regarding continuity of a product line, overall strategy for the client, product mix impact etc.
The above post was written from the angle of comparing year 1 and year - or period 1 and period 2. But instead, it could be actuals vs budget as well.
For the above waterfall, I’ve not taken FX impact or product mix impact which would make the calculations more complex, I’ll cover it in another post.
If you’ve made it till here, thank you. I hope this post has helped you, and if it did, please consider subscribing to the newsletter.